![]()
![]()
Spoof of the LogMAR chart
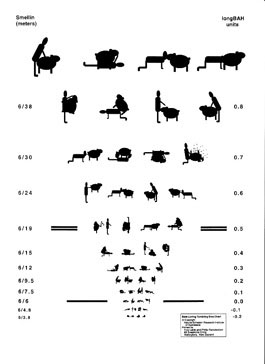 Catalogue Number: 2709 Spoof of the LogMAR chart Category: Memorabilia and ephemera Sub-Category: Memorabilia Designer/inventor: CARKETT, Andrew Year Of Publication/Manufacture: c 1996 Time Period: 1940 to 1999 Place Of Publication/Manufacture: New Zealand Description Of Item: Spoof of the LogMAR charts on a single A4 sheet (multiple copies) on which the orientation of an act of bestiality of a man with a sheep is the resolution task. Undated and of unknown source Historical Significance: The Bailey-Lovie LogMAR chart was designed in 1974 to principles enunciated by Ian L Bailey and Jan Lovie when they were researchers in the National Vision Research Institute of Australia in Melbourne. See Bailey IL, Lovie JE. New design principles for visual acuity letter charts. Am J Optom Physiol Opt. 1976; 53: 740-745 and Catalogue No. 2686. Their work laid the foundation for an international standard for visual acuity charts based on logarithmic scale and with other key characteristics that conform to the Bailey Lovie principles. This spoof version chart was given to Professor Augusteyn by Ian Bailey. Bailey advised by E-mail 20 October 2015 'The sheepish theme of the Bale Loving Chart should have allowed you to deduce, my dear Watson, that its origins were in New Zealand. It was Andrew Carkeet who put that chart together and gave it its name when he was a faculty member in Auckland. I might have had a little to do with subsequent labels and the credits, but the masterpiece is Andrew's.' Andrew Carkeet BAppSc(Optometry) QUT 1987, BA (Psychology) UQld 1987, MSc Houston, PhD QUT 1995, is a member of the academic staff at the Queensland University of Technology. His first academic appointment was as lecturer in optometry at the University of Auckland in New Zealand, a country which has more sheep that people. Bailey also advised that there was another spoof LogMAR chart 'I have now lost my original but in the early 90's an English guy, Peter Howarth printed up a nice looking chart called the Bailey Loves It chart. Each optotype was a wine glass, and each had a different level of red wine. There was also a companion chart - the Low Contrast Bailey Loves It chart which had white wine in the glasses.' How Acquired: Donated by Robert Augusteyn, former Director of the NVRI Date Acquired: Sep 2015 Condition: Good Location: Archive office. Pamphlet and ephemera filing cabinet. Drawer 6 |