![]()
![]()
NVRI 3 metre Hi-Lo LogMAR chart
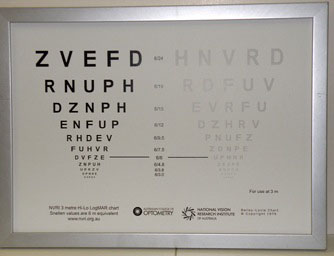 Catalogue Number: 2778 NVRI 3 metre Hi-Lo LogMAR chart Category: Equipment Sub-Category: Visual Acuity, Contrast sensitivity tests Institution: National Vision Research Institute of Australia Year Of Publication/Manufacture: c 2009 Time Period: 1940 to 1999 Place Of Publication/Manufacture: Melbourne Publisher/Manufacturer: National Vision Research Institute of Australia Description Of Item: Letter chart for measuring visual acuity ay two levels of contrast. It has two sets of letters side by side, one set of high contrast and the other side in low contrast, mounted in an aluminium frame, 330 x 450 mm, with a cord on the back for hanging on a wall. Each set of letters has 11 lines of letters and the letters used in the two sets are different. The sizes of the letters are designated in 6 metre Snellen notation, The chart is designed for a test distance of 3 m and this is indicated on the chart. At the bottom of the chart are the following, from left to right: (1) the words 'NVRI 3 metre Hi-Lo LogMAR chart, Snellen values are 6 m equivalent www.nvri.org.au' (2) the words 'AUSTRALIAN COLLEGE OF OPTOMETRY' and the logo of the College, (3) the words 'NATIONAL VISION RESEARCH INSTITUTE' and the logo of the NVRI, and (4) 'Bailey-Lovie Chart copyright symbol Copyright 1975.' Historical Significance: The LogMAR chart was first devised in the NVRI in 1975 by Ian Bailey and Jan Lovie (See Cat 2686 and 2735). The NVRI sold the chart which became widely used and its principles have been accepted internationally, especially for clinical trials. Numerous variants were developed by the NVRI and made available for purchase, including a 3 metre version in 1995 (see Cat No 2736). Interest was aroused in the 1980s in the usefulness of measuring contrast sensitivity in clinical practice and this was pursued in the NVRI by Hess and Howell and in the Victorian College of Optometry by Verbaken, Greeves and Johnston (See See: Verbaken J Role of the contrast sensitivity function in clinical practice. Am J Optom Physiol Opt. 1987; 64:290-5. Verbaken JH, Johnston AW Population norms for edge contrast sensitivity. Am J Optom Physiol Opt. 1986; 63:724-32. Verbaken JH, Jacobs RJ. The technical problems of producing photographic prints for the measurement of human contrast thresholds. Ophthal Physiol Opt. 1985; 5: 459-65. Greeves AL, Cole BL, Jacobs RJ.Assessment of contrast sensitivity of patients with macular disease using reduced contrast near visual acuity charts. Ophthal Physiol Opt. 1988; 8: 371-7. Greeves AL, Cole BL, Jacobs RJ Reliability and validity of simple photographic plate tests of contrast sensitivity. Am J Optom Physiol Opt. 1987; 64(11):832-41. See also the Melbourne Edge test Cat No 1407). The precursor to this low contrast chart was developed by Verbaken in 1986 (Cat 1408). The chart catalogued here is dated after 2009 because it bears the new logos of the College of Optometry and NVRI that were adopted in 2009. Also the College changed its name back to Australian College of Optometry in 2009. Condition: Very good Location: Archive room. West wall. Unit 4 Drawer 3 |